 EN
EN LT
LT DE
DE PL
PL DA
DA SV
SV NB
NB FI
FI IS
ISURNELA / Materials / 01
Polylactic acid.
PLA plant-derived feedstock
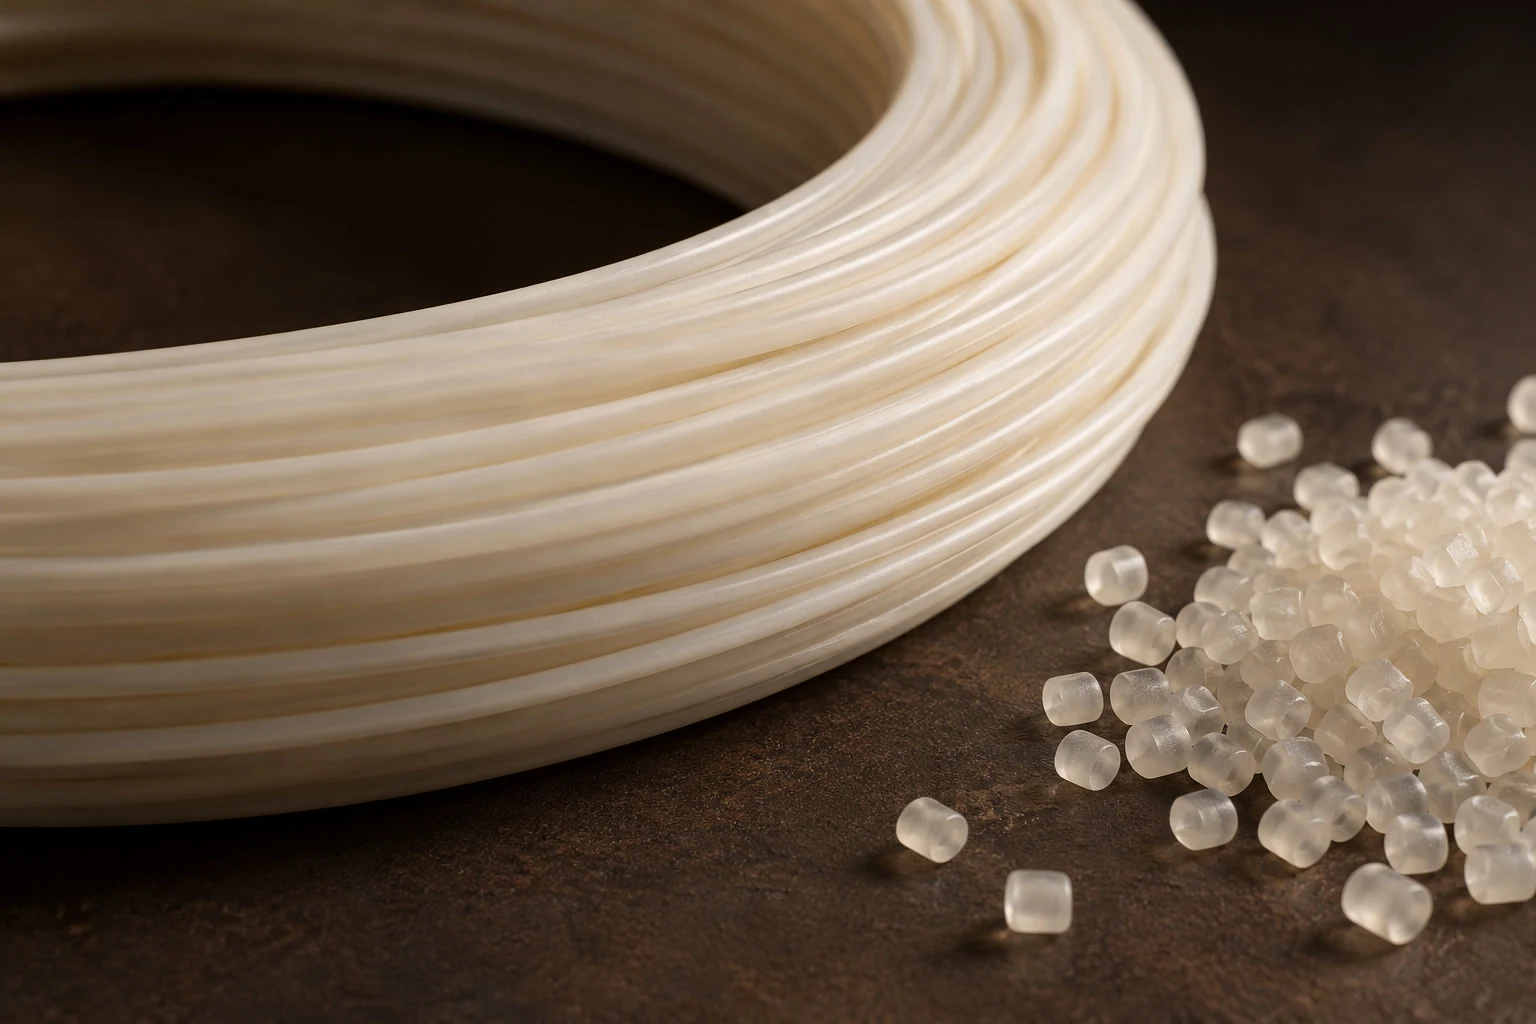
Feedstock and structure
PLA synthesis and feedstock.
Industrial PLA production can begin with sugars from maize, sugar cane, sugar beet or cassava. Fermentation yields lactic acid; further processing produces lactide, which is polymerised into PLA. Feedstock composition and additives vary between commercial grades.
Its renewable carbon source distinguishes PLA from fossil-feedstock polymers. A complete lifecycle assessment also considers pigments, coatings, energy, transport and end-of-life treatment.
Molecular structure
The ratio of L- and D-lactide units influences the ability of chains to arrange into crystals. Stereochemistry therefore affects crystallisation and thermal response.
Number-average and weight-average molecular masses describe the chain-length distribution. It influences melt flow, mechanical response and hydrolytic ageing.
The crystalline fraction depends on grade and thermal history. Cooling and subsequent heat treatment can change the balance between crystalline and amorphous regions.
Material selection
Material comparison.
Natural wood
Wood is renewable and has a distinct grain. It is also hygroscopic and anisotropic: dimensions and properties vary with moisture and grain direction. PLA enables controlled, repeatable geometry with a different approach to surface finish.
Fossil-feedstock polymers
Feedstock origin and functional performance are separate selection criteria. Heat response, impact resistance, dimensional accuracy and surface quality can be compared under defined service conditions.
Thermal behaviour
Thermal transitions and degradation.
Glass transition, deflection under load and chemical decomposition describe distinct responses to heat. Service conditions are established from transition behaviour and mechanical response, not melting temperature alone. Polymer grade, print orientation, wall structure and coating all affect the finished part.
Glass transition
Mobility rises in amorphous chain segments and stiffness changes before melting. Differential scanning calorimetry (DSC) identifies the transition from a change in heat capacity.
Deflection under load
A standard specimen is heated under a defined flexural stress until it reaches a specified deflection. Heating rate, load and specimen geometry are part of the result.
Thermal decomposition
Thermogravimetry measures mass change during heating in a defined atmosphere. The resulting curve characterises degradation separately from shape stability under load.
Measurement principles
Heat-capacity transition

A step in heat capacity marks the glass-transition region.
Deflection criterion

The recorded temperature corresponds to a defined deflection under load.
Mass-loss profile

A mass-change curve describes thermal decomposition.
For printed structures, conditioning, exposure time, wall thickness and deposition direction are recorded alongside temperature. These variables connect a laboratory result to the behaviour of a specific geometry.
Heat transport
Wall thickness changes the heating time scale.
Thermal diffusivity α combines conductivity k, density ρ and specific heat capacity cₚ. For a characteristic wall thickness L, the conduction time scale τ grows approximately with L²/α. Surface temperature and temperature within the wall therefore need not evolve at the same rate.
Hydrolysis
Water can cleave ester bonds in PLA. Elevated temperature and moisture accelerate this process. Molecular-chain shortening may change mechanical properties; it is distinct from simple heat softening.
03 / Print structure
Layer architecture and mechanical response.
In fused-filament fabrication, a part is assembled from adjoining deposited paths. The material grade alone cannot describe its response: path direction, interlayer contact and internal geometry influence strength and dimensional behaviour.
Orientation
Deposited paths carry load differently along a layer and across layer interfaces. A test specimen is therefore described together with its build and raster orientation.
Interlayer contact
Bond formation depends on the temperature and contact time of neighbouring paths. Interfacial continuity affects mechanical response across the build direction.
Wall geometry
Wall count, path width and internal void fraction set the distribution of material through a section. Geometry is considered together with the closure and the required internal volume.

04 / Surface finish
Coating architecture and finish.
A coated PLA surface comprises a prepared substrate, colour layer and, where specified, a protective topcoat. Finish quality depends on surface preparation, compatibility between layers, coating thickness and curing.
A coating specification describes binder chemistry, primer compatibility, curing conditions and care. Gloss can be measured on smooth sample panels; textured surfaces are additionally assessed visually.
Surface energy and microtopography influence wetting. Contact-angle measurements describe how a liquid spreads over the substrate; the cross-cut method assesses a coating’s resistance to separation. Film thickness and curing conditions complete the interface assessment.
05 / Technical information
Technical test methods.
Technical assessment covers feedstock origin, thermal response, flexural behaviour and surface finish. These ISO methods define reproducible measurement conditions and a clear basis for interpreting results.
Biobased carbon fraction determined by ¹⁴C analysis.
Glass-transition temperature measured by differential scanning calorimetry.
Deflection temperature under a defined flexural load.
Mass change during heating; a method for assessing thermal decomposition.
Flexural properties under defined test conditions.
Coating resistance to separation in a cross-cut test.
Gloss measurement of smooth, opaque coatings at 20°, 60° and 85°.
Product-level specification
A complete technical record identifies material grade and supplier, additives and coating system, internal volume, external dimensions and mass, print orientation, wall construction, closure type, test conditions and care requirements. Each result is linked to its tested grade, geometry and finish.